Close Calls And Crashes: A Visual Analysis Of Airplane Safety Data

Table of Contents
Visualizing Near Misses: Understanding the "Close Calls"
Near-misses, or "close calls," are events that could have resulted in an accident but, fortunately, did not. Analyzing this airplane safety data is critical for identifying potential hazards and preventing future incidents.
Data Sources for Near-Miss Analysis
Gathering comprehensive near-miss data is crucial for effective analysis. Several sources provide valuable information:
- Pilot Reports (ASRS): The Aviation Safety Reporting System (ASRS) in the US, and similar programs internationally, collects anonymous pilot reports of unusual events and near-misses.
- Air Traffic Control Logs: Recordings of air traffic control communications often contain valuable information about near-miss situations.
- Radar Data: Radar systems track aircraft movements, and analyzing this data can identify close encounters not reported by pilots or controllers.
- Aircraft Maintenance Logs: These records can reveal mechanical issues that might have contributed to near misses.
Data collection faces challenges, including inconsistencies in reporting, variations in data formats across different sources, and the potential for underreporting due to factors such as fear of repercussions.
Visual Representation of Near Misses
Visualizations effectively communicate complex airplane safety data. Effective techniques include:
- Geographic Maps: Displaying near-miss locations on a map highlights geographical hotspots, revealing areas needing increased attention. Color-coding can represent risk levels (e.g., red for high-risk areas).
- Charts and Graphs: Bar charts can show the frequency of near misses by aircraft type, time of day, or weather conditions. Line graphs can track trends over time.
- Interactive Dashboards: These allow users to explore the data interactively, filtering by various parameters and gaining deeper insights.
Key Findings from Near-Miss Analysis
Visual analysis of near-miss data reveals several important trends:
- Geographical Hotspots: Certain airports or air routes consistently experience a higher number of near misses, indicating potential infrastructure or procedural issues.
- Time-of-Day Patterns: Near misses might be more frequent during certain times of day, suggesting factors such as fatigue or increased air traffic density.
- Aircraft Type Correlations: Some aircraft types may be involved in more near misses than others, pointing to potential design flaws or operational challenges.
Analyzing Aircraft Accidents: Learning from Past Crashes
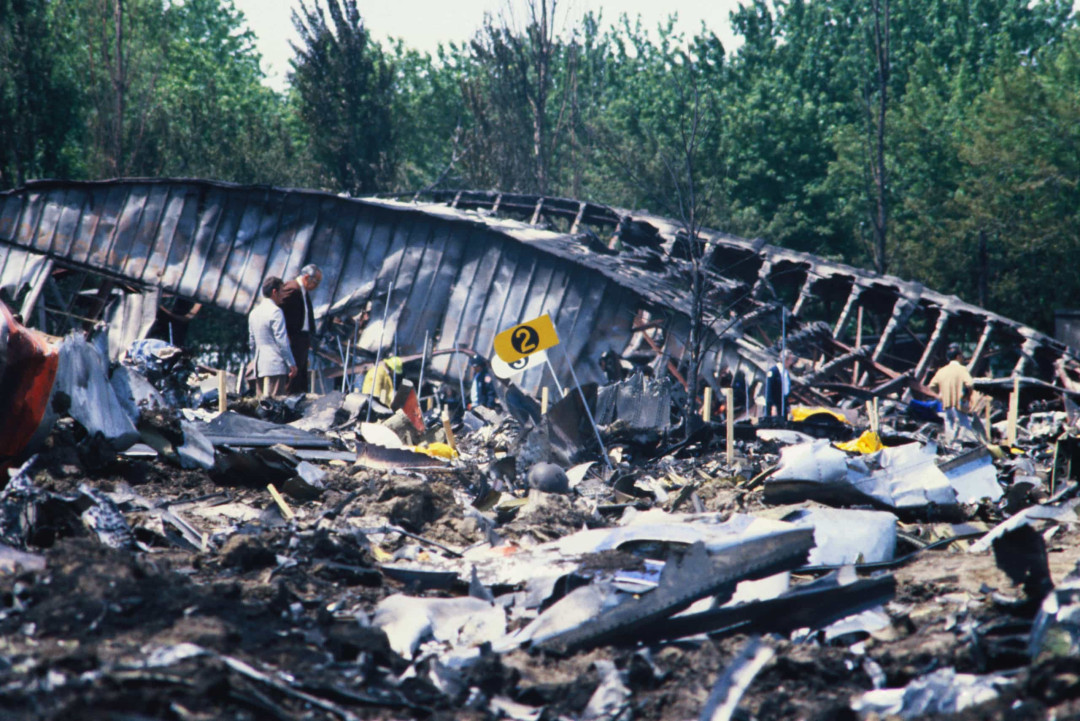
Analyzing aircraft accident data is crucial for understanding causal factors and implementing preventative measures. This analysis of airplane safety data is essential for continuous improvement.
Data Sources for Accident Analysis
Reliable sources of accident data include:
- National Transportation Safety Board (NTSB) Database (USA): This comprehensive database contains detailed reports on aircraft accidents in the United States.
- International Civil Aviation Organization (ICAO) Accident Database: This global database provides information on aircraft accidents worldwide.
- Accident Investigation Reports: Thorough investigation reports provide critical details about the causes and contributing factors to each accident.
Visualizing Accident Data
Visualizations help to uncover patterns and insights within the complex data:
- Timelines: Show the sequence of events leading up to an accident, helping to identify critical moments and contributing factors.
- Network Graphs: Illustrate the relationships between different contributing factors, revealing complex causal chains.
- Statistical Charts: Bar charts can illustrate the frequency of different accident causes (e.g., pilot error, mechanical failure, weather), while pie charts can show the proportion of accidents attributed to each factor.
Key Findings from Accident Analysis
Visual analysis reveals:
- Common Causes: Pilot error, mechanical failure, and adverse weather conditions frequently contribute to accidents.
- Safety Improvements: Over time, safety regulations and technological advancements have led to a reduction in accident rates.
- Effectiveness of Safety Regulations: Visualizing accident data can assess the effectiveness of existing safety regulations and identify areas needing improvement.
Improving Airplane Safety Through Data Analysis
Data analysis plays a vital role in enhancing airplane safety:
Predictive Modeling and Risk Assessment
Data analysis allows for the development of predictive models to identify potential risks:
- Risk Scoring Systems: Assigning risk scores to different factors (e.g., weather, aircraft type, pilot experience) helps prioritize safety interventions.
- Accident Prediction Models: Statistical models can predict the likelihood of future accidents based on historical data.
Targeted Safety Interventions
Insights from data analysis lead to focused interventions:
- Enhanced Pilot Training: Tailored training programs address specific areas identified as contributing factors to near misses or accidents.
- Improved Maintenance Procedures: Data analysis can pinpoint areas where maintenance procedures need improvement to reduce mechanical failures.
- Air Traffic Control Improvements: Data-driven changes in air traffic control procedures can reduce the risk of near misses.
The Future of Airplane Safety Data Analysis
Advancements in technology promise even greater improvements:
- Artificial Intelligence (AI): AI can analyze vast amounts of data to identify subtle patterns and predict potential risks more accurately.
- Machine Learning: Machine learning algorithms can automatically detect anomalies and predict potential safety issues.
Conclusion
Visual analysis of airplane safety data, encompassing both near-misses and accidents, is crucial for enhancing aviation safety. By understanding the patterns and trends revealed through data visualization, we can develop targeted safety interventions and improve flight safety. Stay informed about advancements in airplane safety data analysis; explore publicly available airplane safety data to contribute to safer air travel. Let's work together to leverage the power of airplane safety data to create a future where air travel is even safer.

Featured Posts
-
 Global Bond Market Instability A Posthaste Analysis Of Emerging Risks
May 24, 2025
 -
 Amira Al Zuhairs Stunning Walk For Zimmermann At Paris Fashion Week
May 24, 2025
 -
 Today Show Host Dylan Dreyer The Unexpected Obstacle She Faced
May 24, 2025
 -
 Young Hawaiian Artists Shine Memorial Day Lei Poster Contest
May 24, 2025
 -
 Kyle Walker And Annie Kilner A New Ring And Relationship Speculation
May 24, 2025
Latest Posts
-
 Celebrated Amphibian Speaker At University Of Maryland Commencement Ceremony
May 24, 2025
 -
 Kermits Words Of Wisdom University Of Maryland Commencement Speech Analysis
May 24, 2025
 -
 University Of Maryland Announces Kermit The Frog For 2025 Graduation
May 24, 2025
 -
 World Renowned Amphibian To Address University Of Maryland Graduates
May 24, 2025
 -
 University Of Marylands Unexpected 2025 Commencement Speaker Kermit The Frog
May 24, 2025
